Observability
Instabase provides observability tools for measuring the internal state of its infrastructure and applications.
Log aggregation tooling
Instabase’s log aggregation features let you aggregate logs across Instabase services and store them for purposes including querying, debugging, activity analysis, and alerting.
Log aggregation infrastructure
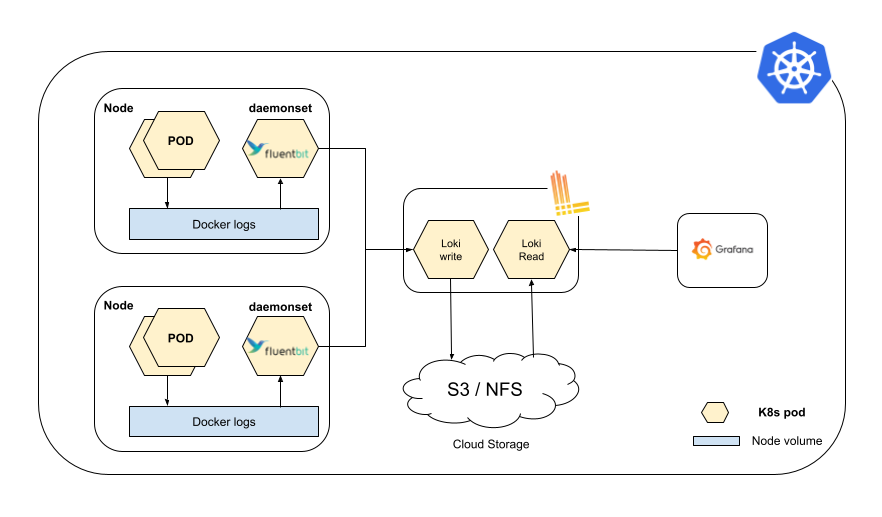
Instabase’s log aggregation solution involves two components working together: a Fluent Bit sidecar and Grafana Loki.
The Fluent Bit sidecar collects the logs from Instabase services inside a pod and sends them to Loki. The sidecar also performs log rotation over the log files that are created by Instabase services. Grafana Loki is a log aggregation storage tool. It’s responsible for aggregating, indexing, and storing the log information. Loki also provides a powerful query language, LogQL, to query logs.
Each container inside the Instabase services pod writes the logs to disk (emptyDir). The disk volume is mounted to the Fluent Bit container running inside the same pod. Fluent Bit tails all log files written by Instabase services on the mounted volume and sends them to Loki.
Grafana Loki has two different types of replicas: read and write. The write replicas are responsible for accepting the streams of logs coming from Fluent Bit. Read replicas serve the read queries. The Loki write replica persists the logs to a storage system shared by both the read and write replicas, either a network file system (NFS) or Amazon S3 bucket. You can then query and visualize the stored logs from your Instabase Grafana dashboard.
Resource requirements
System Requirements
-
Grafana Loki requirements: We recommend running 2 pods of Grafana Loki read replicas and 2 pods of Grafana Loki write replicas (4 pods total). This setup requires the allocation of approximately 2 cores of CPU and 2 GB of RAM.
-
Fluent Bit sidecar requirements: Each Fluent Bit sidecar uses an additional 30 millicores and 35 MB of RAM, which should be factored into the CPU and memory resource calculations.
Cloud storage
Cloud storage that will be shared between all Grafana Loki replicas is required. The cloud storage will store 14 days’ worth of logs. The following cloud storage options are supported:
- NFS volume (~ 64 GB)
- Amazon S3 bucket
Access requirements
To attach metadata to logs, the Fluent Bit sidecar makes calls to the Kubernetes API server to get pods-related information. This requires that the following roles and bindings are granted to the Kubernetes service account that runs Instabase services.
Querying the Kubernetes API server is a one-time operation that happens during pod startup.
apiVersion: rbac.authorization.k8s.io/v1
kind: Role
metadata:
  namespace: {{namespace}}
  name: ib-sa-role
rules:
- apiGroups: [""]
  resources: ["pods"]
  verbs: ["get"]

---

apiVersion: rbac.authorization.k8s.io/v1
kind: RoleBinding
metadata:
  name: ib-sa-role-binding
  namespace: {{namespace}}
subjects:
  - kind: ServiceAccount
    name: {{IB_SERVICE_ACCOUNT}}
    namespace: {{namespace}}
roleRef:
  apiGroup: rbac.authorization.k8s.io
  kind: Role
  name: ib-sa-role
Stats tooling
Instabase provides statistics tooling for observing Instabase’s internal components. This includes measuring aspects of:
-
Infrastructure and application traffic, including request and error rates.
-
Performance, including latencies.
-
Specific internal states, such as worker count in Celery.
-
Saturation of CPU, memory, file system, or open connection handles.
This data is represented as a numerical time series with attributes and labels (such as cluster, service, or container) for filtering and aggregations.
Stats infrastructure
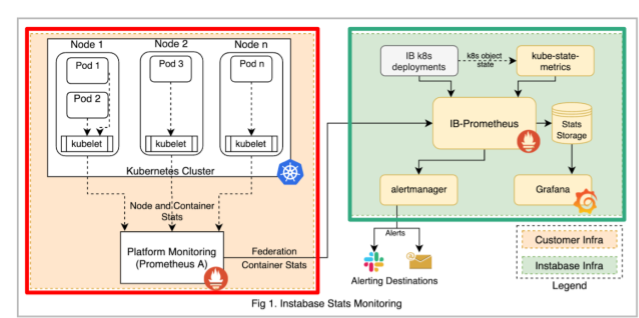
Instabase stats architecture is divided into two parts:
-
Instabase stats infrastructure - this part of the stack is highlighted in the green box in the figure below. The components in this stack are responsible for collecting stats telemetry information from Instabase services. It can also receive stats telemetry data (ex: cpu, memory and network usage) from the cluster control plane.
-
Cluster stats infrastructure - this part of the stack is highlighted in the red box in the figure below.Usually this part of the cluster is already installed/managed by the platform admins for the Kubernetes cluster and you can ask them for details for connecting with platform prometheus. If platform prometheus is not present IB can also install the required components or help directly connect Instabase stats infra (in #1) to the Kubernetes control plane.
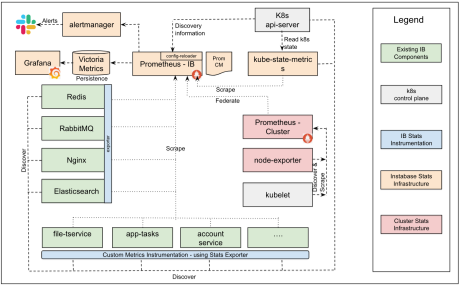
Instabase services (green) are instrumented with telemetry agents (blue) to start providing stats data. The stats infrastructure (yellow) components allow collecting, storing, presenting / alerting on this information. They internally leverage Kubernetes api-server for performing service discovery.
We also create federated Prometheus connection to Kubernetes cluster provided prometheus agent to collect container specific CPU/memory and disk information from kubelet.
Resource requirements
System Requirements
-
Compute and memory: We recommend allocating ~3.5 cores and ~21GB RAM for a typical setup. This may change based on the deployment size and the number of monitored workloads.
-
Persistent Volume 128GB+ for durable stats storage. This is used for storing and querying historical stats data. This is optional to setup, and as an alternative the data can be stored on ephemeral pod storage. Data on ephemeral storage is not available if the prometheus pod is recycled.
Access requirements
-
Access to the namespace to apply the different kubernetes objects such as Roles, Rolebinding, Deployment, Statefulset, Service, Configmap
-
For collecting CPU / Memory information we need stats information from kubelet. For this you need to provide federation connection details [platform prometheus URL and access details] from the design above, and add them into IB prometheus configuration.
-
We use service discovery to identify the targets for stats collection. Following roles / bindings [refer: Role-based Access Control] are required to be granted to the serviceaccount that runs the IB-prometheus service
apiVersion: rbac.authorization.k8s.io/v1
kind: Role
metadata:
  labels:
    app: prometheus
  namespace: ib-namespace
  name: role-ib-prometheus
rules:
  - apiGroups:
      - ""
    resources:
      - services
      - endpoints
      - pods
      - configmaps
    verbs:
      - get
      - list
      - watch

---

apiVersion: rbac.authorization.k8s.io/v1
kind: RoleBinding
metadata:
  labels:
    app: prometheus
  name: rolebinding-ib-prometheus
  namespace: ib-namespace
subjects:
  - kind: ServiceAccount
    name: ibprom
    namespace: ib-namespace
roleRef:
  apiGroup: rbac.authorization.k8s.io
  kind: Role
- To enable service discovery, IB-Prometheus makes HTTP (GET) calls to the kubernetes api-server using following files mounted in the pod for authentication -
/var/run/secrets/kubernetes.io/serviceaccount/namespace
/var/run/secrets/kubernetes.io/serviceaccount/token
/var/run/secrets/kubernetes.io/serviceaccount/ca.crt
- Additionally the kube-state-metrics needs following roles/bindings [refer: Role-based Access Control] in order to read kubernetes object states -
apiVersion: rbac.authorization.k8s.io/v1
kind: Role
metadata:
  labels:
    app: kube-state-metrics
  name: instabase-kube-state-metrics
  namespace: ib-namespace
rules:

- apiGroups: [""]
  resources:
  - configmaps
  - endpoints
  - limitranges
  - persistentvolumeclaims
  - pods
  - replicationcontrollers
  - secrets
  - resourcequotas
  - services
  verbs: ["list", "watch"]

- apiGroups: ["batch"]
  resources:
  - cronjobs
  - jobs
  verbs: ["list", "watch"]

- apiGroups: ["extensions", "apps"]
  resources:
  - daemonsets
  - deployments
  verbs: ["list", "watch"]

- apiGroups: ["autoscaling"]
  resources:
  - horizontalpodautoscalers
  verbs: ["list", "watch"]

- apiGroups: ["extensions", "networking.k8s.io"]
  resources:
  - ingresses
  verbs: ["list", "watch"]

- apiGroups: ["networking.k8s.io"]
  resources:
  - networkpolicies
  verbs: ["list", "watch"]

- apiGroups: ["policy"]
  resources:
    - poddisruptionbudgets
  verbs: ["list", "watch"]

- apiGroups: ["extensions", "apps"]
  resources:
  - replicasets
  verbs: ["list", "watch"]

- apiGroups: ["apps"]
  resources:
  - statefulsets
  verbs: ["list", "watch"]

- apiGroups: ["storage.k8s.io"]
  resources:
    - volumeattachments
  verbs: ["list", "watch"]

---

apiVersion: rbac.authorization.k8s.io/v1
kind: RoleBinding
metadata:
  labels:
    app: kube-state-metrics
  name: instabase-kube-state-metrics
  namespace: ib-namespace
roleRef:
  apiGroup: rbac.authorization.k8s.io
  kind: Role
  name: instabase-kube-state-metrics
subjects:
- kind: ServiceAccount
  name: {{service_account}}
  namespace: ib-namespace
Install stats
-
Create service accounts, roles and rolebindings for prometheus based on the files provided to you.
-
Apply the configmaps, deployment and services files shared with you. For setting up federation add the url and authentication details (if applicable) to Prometheus configmap file for the “job_name: ‘federate”.
-
Confirm that the following links are accessible via IB base urls. The login credentials for these are shared separately with Instabase
- Grafana: <base_url>/grafana
- Prometheus: <base_url>/prometheus/graph
- Alertmanager: <base_url>/alertmanager
-
Confirm that the datasources are available in Prometheus by navigating to status > targets in Prometheus UI.
-
Confirm that alerts are also available in the alerting UI by confirming for the dummy watchdog alert in the following screenshot.
-
Confirm that the data is available in grafana dashboards.